ECR 2015 / C-1764
CT Signs of Solitary Pulmonary Lesions: Revisited
This poster is published under an open license. Please read the disclaimer for further details.
Congress:
ECR 2015
Poster Number:
C-1764
Type:
Educational Exhibit
Keywords:
CT, Thorax, Lung, Contrast agent-intravenous, Cancer, Inflammation
Authors:
H. Hayashi, K. Ashizawa, Y. Ogihara, A. Nishida, T. Tanaka, J. Fukuoka, M. Uetani; Nagasaki/JP
DOI:
10.1594/ecr2015/C-1764

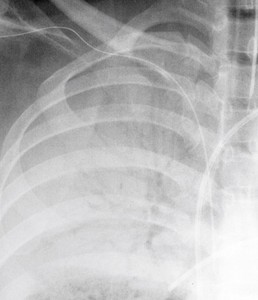
Fig. 1:
Pneumonia. Chest radiograph shows consolidation with air bronchogram.
 shows an “air bronchogram” running into the lesion.")
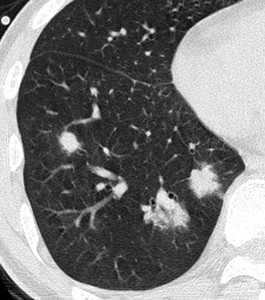
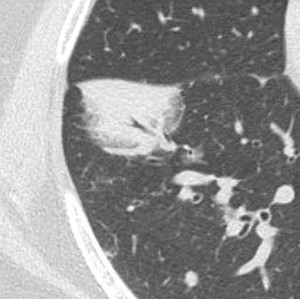
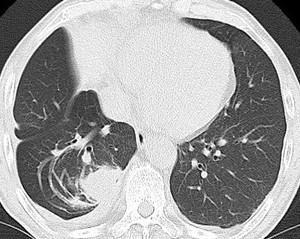
Fig. 2:
Adenocarcinoma. Thin-section CT (TSCT) shows an “air bronchogram” running...
 entering into the tumor.")
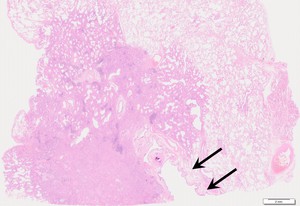
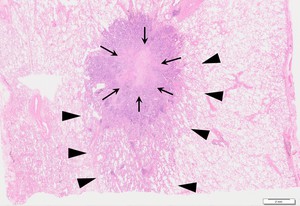
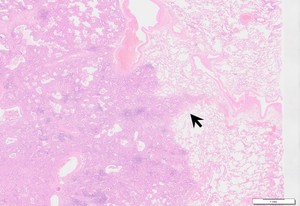
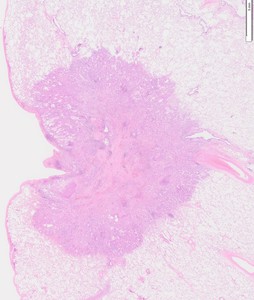
Fig. 3:
Adenocarcinoma. Pathological microphotograh in low magnification view shows...

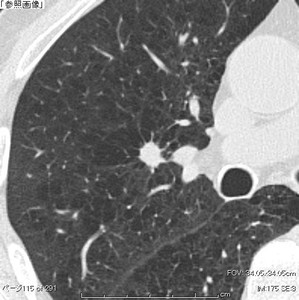
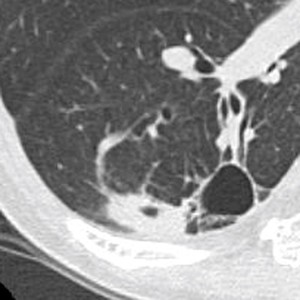
Fig. 4:
MALT lymphoma. TSCT shows an “air bronchogram” in the lesion.

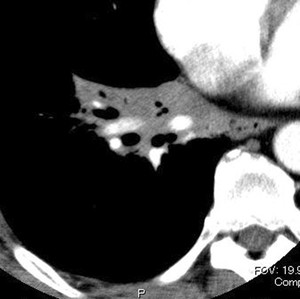
Fig. 5:
Mucinous adenocarcinoma. Contrast-enhanced CT scan reveals CT angiogram sign.
 inside the lesion.")
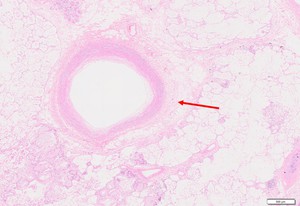
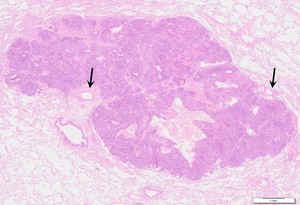
Fig. 6:
Invasive mucinous adenocarcinoma. Pathological microphotograh in low...

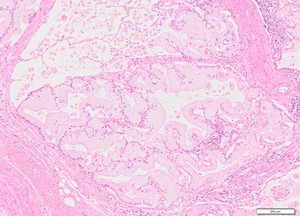
Fig. 7:
Invasive mucinous adenocarcinoma. Pathological microphotograh in higher...

Fig. 8:
MALT lymphoma. Contrast-enhanced CT scan reveals CT angiogram sign.

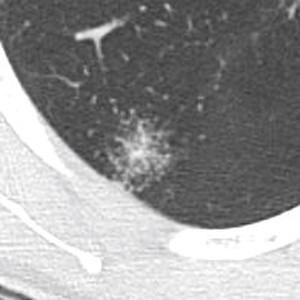
Fig. 9:
Angioinvasive aspergillosis. TSCT shows ill-defined ground-glass opacity...

Fig. 10:
Adenocarcinoma. TSCT shows zone of intermediate attenuation surrounding the...
 and lepidic growth pattern (arrow heads) at the periphery.")
Fig. 11:
Adenocarcinoma. Pathological microphotograh in low magnification view shows...

Fig. 12:
MALT lymphoma. TSCT shows ill-defined ground-glass opacity surrounding the...

Fig. 13:
Cryptogenic organizing pneumonia. TSCT shows a ring of consolidation...

Fig. 14:
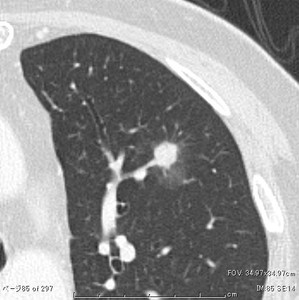
Adenocarcinoma. TSCT shows a pulmonary nodule with irregular margin and spicula.
.")
Fig. 15:
Adenocarcinoma. Pathological microphotograph shows irregular margin of the...

Fig. 16:
Inflammatory nodule. TSCT shows a pulmonary nodule associated with pulmonary...

Fig. 17:
Squamous cell carcinoma. TSCT shows a lobulated nodule.
 in contrast-enhanced CT.")
Fig. 18:
Vessels are seen at the notch of the tumor margin (arrow) in contrast-enhanced...
 at edge of the squamous cell carcinoma.")
Fig. 19:
Pathological microphotograph in low magnification view shows the vessels...

Fig. 20:
Adenocarcinoma. TSCT shows a pulmonary nodule with irregular margin, spicula...

Fig. 21:
Adenocarcinoma. TSCT shows a pulmonary nodule present far from chest wall....

Fig. 22:
Pathological microphotograph in low magnification shows the adenocarcinoma...

Fig. 23:
Pulmonary aspergillosis. TSCT shows a mass with “air-crescent sign” in the...

Fig. 24:
Rounded atelectasis. A “comet tail sign” is produced by the distortion of...
. TSCT shows a cavitating nodule with distinct central vessel leading into it.")
Fig. 25:
GPA (Granulomatosis with polyangitis). TSCT shows a cavitating nodule with...

Fig. 26:
Pulmonary sarcoidosis. TSCT shows “sarcoid galaxies” that are composed of...